![]()
[Mar-2024] Qlik QSBA2021 Official Cert Guide PDF
Exam QSBA2021: Qlik Sense Business Analyst Certification Exam - February 2021 Release - iPassleader
NEW QUESTION # 13
A company CFO has requested an app that contains visualizations applicable to analyzing the finance data Each regional finance team will analyze their data, and the app must contain a high-level sheet that navigates to relevant detail sheets.
Which features support a logical design structure?
- A. A pivot table that filters by region
- B. A dashboard of KPIs and section access
- C. A Multi KPI set analysis
- D. A dashboard with regional bookmarks
Answer: C
NEW QUESTION # 14
Refer to the exhibit.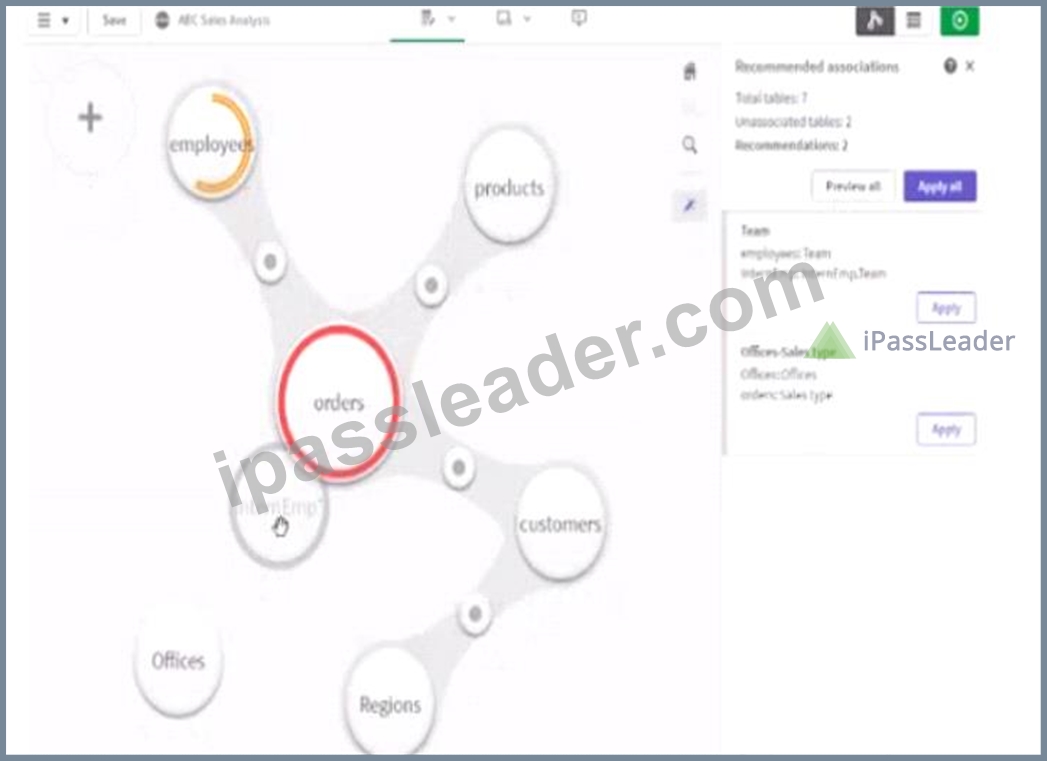
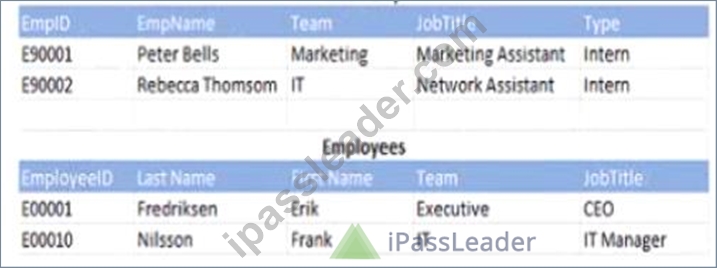
A business analyst must add a list of interns to the current sates app. The app contains an existing employees table When the business analyst profiles the data the association vow displays possible associations as shown.
Which action should the business analyst take to meet the requirements?
- A. Force an association between the InternEmp and the Orders tables
- B. Concatenate the InternEmp table to the Employees tables within data manager
- C. Create an association between the EmpID and EmployeelD fields
- D. Create a concatenated key to associate the Employees and internEmp tables
Answer: B
NEW QUESTION # 15
A business analyst wants to create a dashboard for the Finance team to use The app must include four sheets one looking at the full dataset and three others focused on the regions APAC EMEA and AMERICAS each.
The team needs visualizations for
* Sales by Product in the past 6" months
* Cost of Sales on a map by Country
* Sales Cost and Margin by Month
Additionally the learn wants to dear fillers while navigating between sheets and enable chat in the hub Which features should be used?
- A. Create default bookmark, maps sheet actions enable the insight Bot
- B. Create master measures sheet actions maps enable Insights in app capacities
- C. Create default bookmark GeoAnalytics alternate states enable the insight Bot
- D. Create master measures alternate states GeoAnalytics enable Insights in app capabilities
Answer: A
NEW QUESTION # 16
A business analyst inherits an app full of sheets The business analyst needs to redesign the app using the DAR principle How should the business analyst order the visualizations?
- A. * KPIS
* Ba' Chart Pie Chart Line Chart
* Table Pivot. Table - B. * Bar Chart Pie Chart Line Chart
* Table Pivot Table
* KPIs - C. * KPIs
* Table PivotTable
* Bar Chart Pie Chart Line Chart - D. * Bar Chart Pie Chart Line Chart
* KPIs
* Table Pivol Table
Answer: B
NEW QUESTION # 17
A large auditing firm has a proprietary web portal that all of the' customers use to access their own dat a. The owner of the portal has asked if it is possible to embed some Ok visualizations within the portal when will present the data back to the Individual customers.
The data within the visualizations must be live and provide up-to-date data every time the customer logs in to the portal and updates when the Qlik Series app is reloaded.
What should the business analyst recommend?
- A. Qlik APIs
- B. ODAG
- C. Embedded Stories
- D. Qlik Dynamic \news
Answer: C
NEW QUESTION # 18
A business analyst is designing a business intelligence solution to track production. There are several requirements in the complicated factory environment
* Printed work summary documents produced daily
* Information monitors that show custom website with visualizations from QIA Sense
* Ability to calculate the shortest routes between two sets of coordinates Which three options are needed to meet these requirements? (Select three)
- A. Custom objects
- B. Mashup
- C. Qlik GeoAnalytics
- D. Qlik Compose
- E. Qlik NPrinting
Answer: B,C,E
NEW QUESTION # 19
A company that manages several tennis clubs uses an app mat includes three master measures TotalCost, Totallncome. and TotalMargin A business analyst needs to create a new table that utilizes master items and meets the following requirements:
* Number of bookings that users make
* Cost associated with booking (including electricity and indirect costs)
* Income obtained and profit originated m each booking
* Sales margin: percentage of margin over income
* Detail by tennis clubs
Which optimal expressions should the business analyst use?
- A. * count(dislinct BookinglD)
* [TolalCost]
* [Totalincomel
* ITotalincome|-[TotalCost]
* [TotalMargin]/{Totalllncome}*100 - B. * count(distinct BookinglO)
* [TolalCost]
* [Totalincomel
* ITotalincome|-[TotalCost]
* [TotalMargin]/{Totalllncome}*100 - C. * count(BookinglD)
* [TolalCost]
* [Totalincomel
* sum(income|-sum[TotalCost]
* [TotalMargin]-sum(Cost)/sumTotal(lncome)*100 - D. * count(dislinct BookinglD)
* [TolalCost]
* [Totalincome]
* [Totalincome|-[TotalCost]
* [TotalMargin]/[Totalllncome}*100
Answer: D
NEW QUESTION # 20
A customer wants to perform a regional sates analysis to learn how products set over time m different areas The business analyst needs to design a sheet in the app tor business users to perform several tasks
* Select two different groups of countries to study
* Compare sales over time between these two groups using a bar chart
* Change the group items by selecting different countries at any time
* Select a time range in the bar chart and drill-down to daily transactional sales Which steps should the business anaryst follow to meet these requirements?
- A. * Create two Alternate States Set1 and Set2
* Create two Filter Panels each associated with an Alternate State
* Create a Bar chart with a drill-down dimension and two measures sum({Set1'$} Sales) and sum{fSet2"S} Sales) - B. * Create one Alternate State Set1
* Create two Filter Panels one associated lo this Set1 and one Default State1($)
* Create a Bar chart with the drill-down dimension and two measures sum({Set1-$) Sales) and sum('Set1-S) Sales) - C. * Create one Alternate State Set1
* Create two Filter Panels one associated to this Set1 and one Default State(S)
* Create a Bar chart with the drill-down dimension and two measures sum({Set1'$} Sales)and sum({'Set1"S) Sales) - D. * Create two Alternate States Sell and Set2
* Create two Finer Panels each associated with an Alternate Stale
* Create a Bar chart with drill-down dimension and two measures sum({Set1'S} Sates) and sum({,Set2'*S} Sales)
Answer: D
NEW QUESTION # 21
A business analyst s creating an app for the sales team. The app must meet several requirements
* Compare 10 top -performing sales representatives and the amount of sales for each
* Investigate margin percentage and total sales by each product category
* View distribution of sales amount
Which visualizations should be used for this app?
- A. A treemap box plot, and histogram
- B. A bar chart scatter plot and histogram
- C. A bar chart, line chart, and scatter plot
- D. A treemap container and distribution plot
Answer: A
NEW QUESTION # 22
A company installs Qlik Sense on Windows without any additional visualization bungles A business analyst must create an app with three sheets
* Sheet 1 KPIs and sales trends for the past 12 months
* Sheet 2 Regional sales by representative
* Sheet 3 Sales by country displayed in a map
Users must be able to view all of the sheets and make selections for their analyses.
Which three objects should be added to the three sheets? (Select three)
- A. Filter panes KPls and a combo chart
- B. Filter pane bar chart and KPIs
- C. Filter panes KPIs and a line chart
- D. Filter pane KPls and a map
- E. Filter pane scatter plot and a map
Answer: A,C,D
NEW QUESTION # 23
Refer to the exhibit.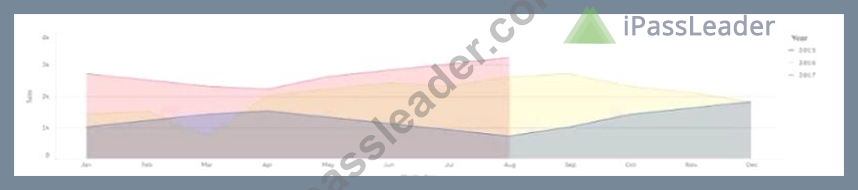
A CEO wants to use a similar visualization on the company's dashboards
The visualization must meet several requirements
* Show three years of sales data
* Display sales trends by month
* Allow comparison of years using an area style display
Which set of actions should a business analyst take to meet these requirements?
- A. * Add an area chart
* Add Month first then Year as the dimensions
* Add SumfSates) as the measure
* In the properties panel under Area select the dimension Year - B. * Add an area chart
* Add Year first then Month as the dimensions
* Add Sum(Sales) as the measure
* In the properties panel under Area select the dimensions - C. * Add a ,line chart
* Add a master drill-down dimension with Year and Month
* Add Sum(Sates) as the measure
* In the properties panel under Presentation, select Area - D. * Add a fine chart
* Add Month first then Year as the dimensions
* Add Surry Sales > as the measure
* In the properties panel under Presentation select Area
Answer: B
NEW QUESTION # 24
A business analyst is creating an app that requires several visualizations
* A scatter plot mat shows the margin percentage and total sales by product category
* A map with a the layer that visualizes lines between retail stores and lactones
* A KPI that shows total cost
Margin% can be calculated by dividing profit by revenue Profit is the difference between total cost and total sates Which two sets of fields can the business analyst use to meet these requirements? (Select two.)
- A. Line Geometry
- B. Product Category
Location - C. Product Category
Retail Store Location
Factory Location - D. Sales
Total Cost - E. Line Geometry
Margin%
Answer: A,D
NEW QUESTION # 25
A business analyst is creating an app for technicians. The app must meet several requirements
* Visualization labels must change according to the selected tame period
* A button to toggle between Month and Year to Date (YTD)
* Two fields combine to create one dimension that is used m several visualizations Which three options are needed to meet the requirements? (Select three.)
- A. Master items
- B. Set analysis
- C. Alternate states
- D. Calculated fields
- E. Variables
Answer: A,D,E
NEW QUESTION # 26
A marketing team is using an app to analyze the company events. The team registers attendees with information such as an ID name and region and discusses business opportunities with attendees Opportunities are evaluated m time and set to a different status.
The team wants to use insight Advisor to query events and opportunities to:
* Review specific areas and periods
* Use marketing terms not currently present in the app when classifying opportunities
* Define calendar periods and add calculations for specific data fields Some examples are as follows: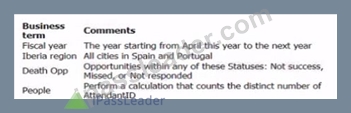
Which process should the business analyst follow?
- A. Create master dimensions and measures, including calendar measures to define fiscal periods Use tags to improve the insight Advisor search features and include vocabulary terms
- B. Update the data set using data manager or data load editor to include these terms as flags or values in the data set Also define the variable to determine which calculation should be used for each field
- C. Define me business logic and vocabulary to define values using the fields m me data set Create groups and set properties in fields Use Calendar groups to define custom periods
- D. Add tags into the data fields to improve how the Insight Advisor identifies the fields when using the natural language queries Use the Selection tool to remove any tads not needed for the search results
Answer: B
NEW QUESTION # 27
A company CEO requests a dashboard that easily displays provides understating and tracks company performance. There are several ma n dashboard requirements:
* Viewable by a mobile device
* Display multiple key measures
* Provide ability to easily navigate to other sheets
Which feature meets these requirements?
- A. Multi master item visualizations
- B. Multiple visualizations m a container
- C. Multiple text and images visualizations
- D. Multi KPI object with master visualizations
Answer: A
NEW QUESTION # 28
Refer to the exhibit.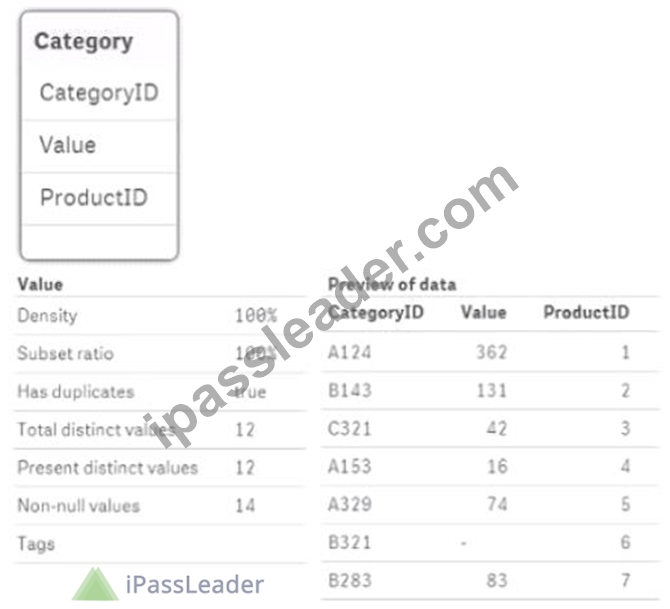
After the latest data reload a business analyst notices the value tor CategoryID 'B321' seems different What is causing this discrepancy?
- A. Null values are deluded in the source data
- B. The data type for CategorylD 332V does not match the others
- C. Some categories do NOT exist in the Category table
- D. Hyphen character ('.') is included m the source data
Answer: B
NEW QUESTION # 29
A business analyst using a shared folder mapped to S \419379942\ receives an Excel We with more than 100 columns Many of the columns are duplicates. The current set of columns mat should be used have the suffix '_c* appended to the column name What should the business analyst do to load the Excel data?
- A. Load all columns because the recommended associations will use only columns with the suffix '_c*
- B. Deselect the fields that do NOT have the '_c' suffix in the data manager table preview
- C. Open the Excel file, remove all columns that do not have the suffix '_c' and save t>e Me to be loaded
- D. Utilize drier functionality in the data manager to select only columns with the suffix _C with a fitter condition
Answer: D
NEW QUESTION # 30
How does the Qlik Associative Engine analyze data from one or more data sources?
- A. Associates data into cubes to enable multidimensional analysis
- B. Inner joins multiple data sources together to remove unrequired information
- C. Creates a set of pre aggregated queries for Qlik Sense to run
- D. Combines multiple data sources without pre-aggregation
Answer: C
NEW QUESTION # 31
A business analyst creates an app for a large retailer The app is based on me past ^2 months of transactional data in CSV formal After successfully demonstrating the app the retailer provides a tile that contains another seven years of data After the new data is loaded the previously responsive app takes 10 times longer to respond to users' selections The app has many complex expressions Which two actions should the business analyst take to resolve the issues? (Select two)
- A. Replace set analysis with calculated fields in the data manager
- B. Make sure a I master items contain variables that define the expressions
- C. Request the data architect to create flags in the data model to optimize set analysis expressions
- D. Use JOIN statements to reduce the number of tables m the data model
- E. Create versions of the app using a WHERE clause m the data manager to restrict the data
Answer: B,C
NEW QUESTION # 32
A company CEO requests an app that contains global sales information. The CEO needs to present this information to an audience of international investors during an upcoming meeting The presentation must meet several requirements
* Contain visualizations that present dearly to a large audience
* Answer audience questions dynamically
* Be made available as shared content
* Emphasize important sales revenue
Which Qlik Sense features must the business analyst prepare?
- A. Create a sheet that features colorful and layered visualizations and export as a PDF
- B. Embed a video player m the shared app with a recording to describe the charts
- C. Set up Nprinting to connect to the app and design a slideshow-style report
- D. Create a storytelling narration m a published app that contains embedded sheets
Answer: B
NEW QUESTION # 33
......
Free QSBA2021 Exam Dumps to Improve Exam Score: https://www.ipassleader.com/Qlik/QSBA2021-practice-exam-dumps.html
2024 Realistic QSBA2021 Dumps Exam Tips Test Pdf Exam Materials: https://drive.google.com/open?id=1Z9buqBRXJJWUJHGZ0VX-v5z4-PPMfbK6